Canadian Business Insolvencies Were Up 33.8% YoY in Q1-22
Last week, Canadian Lawyer magazine reported business insolvency filings were up 1/3 over the same quarter last year. That’s the highest year over year increase in 31 years (i.e. since 1991). Bankruptcy filings are regulated and recorded by the Office of the Superintendent of Bankruptcy
By now, most COVID restrictions have been lifted, but so have the government support programs. That means businesses (and individuals) are on their own. Expect some hiccups as they adjust to the new realities like supply chain re-alignments, staffing and product shortages, a war in Ukraine, etc.
“With inflation now at a 30-year high, the conditions are ripe for further business insolvencies. Business owners and inhouse counsel should prepare by consulting with an insolvency professional as early as possible” said Jean-Daniel Breton, chair of the Canadian Association of Insolvency and Restructuring Professionals.
Those business owners who are susceptible to economic shifts should consider holding some or all of their financial assets with an insurance company. Provided their structured properly, assets held with an insurer (i.e. in an insurance contract) are typically exempt from creditors. That’s because government and the law decided long ago that “insurance” is a societal good. Most common law provinces are on side with the exemption.
In February 1996, the Supreme Court decided a landmark case in Royal Bank vs. North American Life Assurance Co.The case surfaced because a doctor in Saskatoon fell on hard times and couldn’t pay his rent. The landlord sued and the doctor declared bankruptcy. When creditors attempted to seize registered (RRSP) assets that were held with North American Life Insurance company, the Saskatchewan court “exempted” these assets. The case was appealed by the Royal Bank of Canada all the way to the supreme court (seems lenders don’t like the idea of some assets being exempted – especially by life insurance companies).
In their ruling, the Supreme Court of Canada based their conclusion on three critical issues:
#1 – The assets in question were governed by provincial Life Insurance legislation.
#2 – The owner had designated a preferred class of beneficiary (i.e. family member).
Nearly all the REITs held in our Real Estate investment contracts have reported their first quarter earnings. Canadian Apartment REIT reports tomorrow.
Normally, one shouldn’t attach too much significance to quarterly earnings as it can take years for the value of great properties and enterprises to be realized. Nevertheless, operating results for the first quarter are presented here as an indicator of how business operations are unfolding as the REITs and economy emerge from pandemic restrictions.
Overall, revenues, income, funds from operations (FFO), occupancies have improved significantly. CAP REIT reports tomorrow. Rio-Can figures reported in an earlier blog and can be viewed here: https://think-income.com/2022/05/11/getting-it-reit/
On April 27, Allied Properties REIT reported the following:
“Allied’s first-quarter results for 2022 met or exceeded expectations, with AFFO per unit and average in-place net rent per occupied square foot rising to record levels,” said Michael Emory, President & CEO. “FFO per unit was 61 cents and AFFO per unit 56 cents, up from the comparable quarter last year by 4% and 7%, respectively. NAV per unit at quarter-end was $50.92, up from the end of the first quarter last year by 5% and up from the end of 2021 by 1%. Leasing activity continued to accelerate through the quarter, with average in-place net rent per occupied square foot rising to $25.13, up from the comparable quarter last year by 4% and up from the end of 2021 by 2%.”
On May 9th, Boardwalk posted their quarterly results. Chairman & CEO Sam Kolias reported:
“We are pleased to report on another solid quarter to begin 2022, with growth in NOI, FFO, and Profit through the Omicron wave of the pandemic and non-controllable cost inflation primarily in our utilities expense through the winter months. As we look forward to our busy spring and summer leasing season, we have seen significant leasing gains with our May occupancy increasing to 96.6%. Leasing spreads on both renewals and new leases have seen strong improvement, and in our largest market of Alberta, have seen renewal spreads increase to 4.7% in the month of April. New lease spreads have also turned positive with housing fundamentals improving in each of our markets allowing for incentive reductions and positive rental rate growth.”
On May 3rd, Dream Industrial reported net income of $442.9 million in Q1 2022, a 364.9% increase when compared to $95.3 million in Q1 2021. The increase was primarily due to increases in fair value adjustments to investment properties (NOTE: companies are required to include unrealized gains in the value of assets as a part of earnings).
Net rental income was $65.3 million in Q1 2022, a 40.0% increase when compared to $46.7 million in Q1 2021. Year-over-year net rental income growth was primarily driven by 38.8%, 46.5% and 264.9% increases in Ontario, Québec and Europe, respectively.
Diluted funds from operations (“FFO”) per Unit were $0.22 in Q1 2022, a 16.0% increase when compared to Q1 2021, where the diluted FFO per Unit were $0.19.
• Total assets were $6.7 billion in Q1 2022, a 10.8% increase when compared to $6.1 billion in Q4 2021;
• Net asset value (“NAV”) per Unit was $16.48 in Q1 2022.
For the three months ended March 31, 2022, First Capital recognized net income attributable to Unitholders of $44.5 million or $0.20 per diluted unit compared to $38.0 million or $0.17 per unit for the same prior year period. The increase was primarily due to an increase in the fair value of investment property of $8.8 million.
FFO per unit remained unchanged primarily due to a $3.1 million increase in interest and other income, and interest expense savings of $2.8 million, which were offset by other losses primarily related to unrealized losses on marketable securities, totaling $6.8 million, or $0.03 per unit.
SPNOI – Same Property NOI Growth increased 1.9%, despite a 20 basis point decline in occupancy. The growth was primarily due to a $2.2 million decrease in bad debt expense as well as rent escalations, partially offset by lower occupancy and a $0.6 million decrease in lease termination fees over the prior year period.
Portfolio Occupancy: March 31, 2022 portfolio occupancy of 95.5% decreased 0.6% on a quarter-over-quarter basis from 96.1% at December 31, 2021 primarily due to net closures (which primarily related to closures for redevelopment). On a year-over-year basis, total portfolio occupancy declined 0.3% from 95.8% at March 31, 2021 to 95.5% at March 31, 2022.
Granite’s net operating income (“NOI”) was $91.2 million in the first quarter of 2022 compared to $81.5 million in the prior year period, an increase of $9.7 million primarily as a result of net acquisition activity beginning in the first quarter of 2021;
• Same property NOI (Net Operating Income) or SPNOI – cash basis increased by 4.6% for the three-month period ended March 31, 2022.
• Funds from operations (“FFO”)(1) were $69.4 million ($1.05 per unit) in the first quarter of 2022 compared to $57.1 million ($0.93 per unit) in the first quarter of 2021.
• Granite recognized $490.6 million in net fair value gains on investment properties in the first quarter of 2022 which were attributable to various factors including fair market rent 1 increases as well as compression in discount and terminal capitalization rates for properties located in the GTA, the United States and Europe. The value of investment properties was partially offset by unrealized foreign exchange losses of $146.1 million resulting from the relative strengthening of the Canadian dollar against the US dollar and
• Granite’s net income attributable to stapled unitholders increased to $497.7 million in the first quarter of 2022 from $230.1 million in the prior year period primarily due to a $281.1 million increase in net fair value gains on investment properties and a $9.7 million increase in net operating income as noted above, partially offset by a $30.6 million increase in deferred tax expense
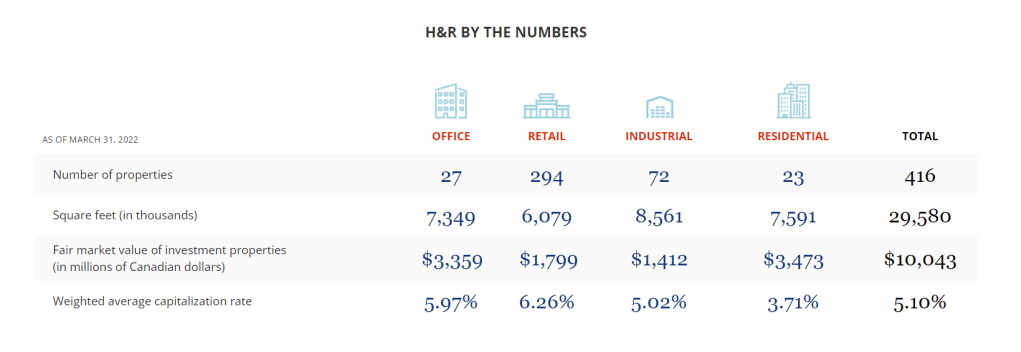
On May 12, 2022, H&R Real Estate Investment Trust (“H&R” or “the REIT”) (TSX: HR.UN) reported the following operating results:
“Our strong first quarter financial results mark a pivotal moment in the continuation of our transformation and the surfacing of the embedded value within our portfolio,” said Tom Hofstedter, CEO. “Following the successful spin out of our enclosed shopping centre division (i.e. Primaris) and the sale of the Bow and Bell office campus, our portfolio today is significantly more concentrated on higher growth asset classes within strong urban markets. Today’s results are a testament to the quality of our properties, platform and strategic plan.”
Highlights
30.9% decrease in net operating income as compared to Q1-2021 primarily due to the spin‐off of Primaris REIT and property dispositions throughout 2021;
$19.88 unitholders’ equity per Unit, an increase of $3.33 from December 31, 2021;
$21.06 Net Asset Value (“NAV”) per Unit(2), an increase of $3.36 from December 31, 2021;
Sold 33.3% non‐managing interest in The Pearl, in Austin, Texas for approximately U.S. $45.8 million, generating a gain of $20.7 million over construction cost, and a return on equity invested of approximately 221.5%;
13,715,500 Units repurchased year to date, at a weighted average price of $12.97 per Unit, for a total cost of $177.8 million as at May 10, 2022;
19.1% Same‐Property net operating income (SPNOI) (cash basis)(1) growth driven by strong residential and office rental growth together with industrial and retail property lease‐ups
“Killam’s first quarter earnings growth and operating performance were strong,” noted Philip Fraser, President and CEO. “The same property revenue growth of 5.1% in Q1-2022 reflects the strong demand for housing across all our markets. Despite a colder winter season and higher heating costs this quarter, Killam achieved 3.1% same property net operating income growth to start the year.”
Killam earned net income of $60.0 million in Q1-2022, compared to $27.4 million in Q1-2021. The increase in net income is primarily attributable to fair value gains on investment properties, growth through acquisitions, completed developments, and increased earnings from the existing portfolio.
Killam generated FFO per unit of $0.24 in Q1-2022, a 4.3% increase from $0.23 per unit in Q1-2021. AFFO per unit increased 5.3% to $0.20, compared to $0.19 in Q1-2021. The growth in FFO and AFFO was primarily attributable to increased NOI from Killam’s same property portfolio and incremental contributions from over $400 million in recent acquisitions. This growth was partially offset by a 9.4% increase in the weighted average number of units outstanding.
Despite inflationary pressures, Killam achieved 3.1% growth in same property consolidated NOI during the quarter. This improvement was driven by 5.1% growth in revenue, partially offset by an 8.2% increase in operating expenses.
On May 11, SmartCentres REIT reported, “substantive improvement in retail leasing momentum across the portfolio with growth from both existing and new tenants;”
Highlights:
Progress in zoning approvals on strategic projects, together with improved market conditions, contributed to $237.7 million in incremental property values, leading to net income and comprehensive income for Q1 2022 increasing to $370.1 million compared to $60.6 million for the same period in 2021; from an increase of $1.71 per Unit;
FFO per Unit(1) for Q1 2022 increased by $0.02 or 4.1% as compared to the same period in 2021;
Total unencumbered assets(1) increased from $5.9 billion at March 31, 2021 to $8.4 billion at quarter end; and
Continued advancement of non-retail pipeline of 283 projects representing approximately 59 million square feet across the network (41 million square feet at the Trust’s share)
Tom Gayner once commented that the secret to investing successfully is surviving the first thirty years. He was half joking and half serious, but his reasoning was sound. He suggested, after that length of time an investor would have experienced several market trends and cycles and he ought to be able to recognize their recurrence.
Since the new year, market participants have seen the following:
a hike in interest rates
a 13.5% decline in the S&P 500
a 9.5% decline in the Dow Jones Industrial Average (DJIA)
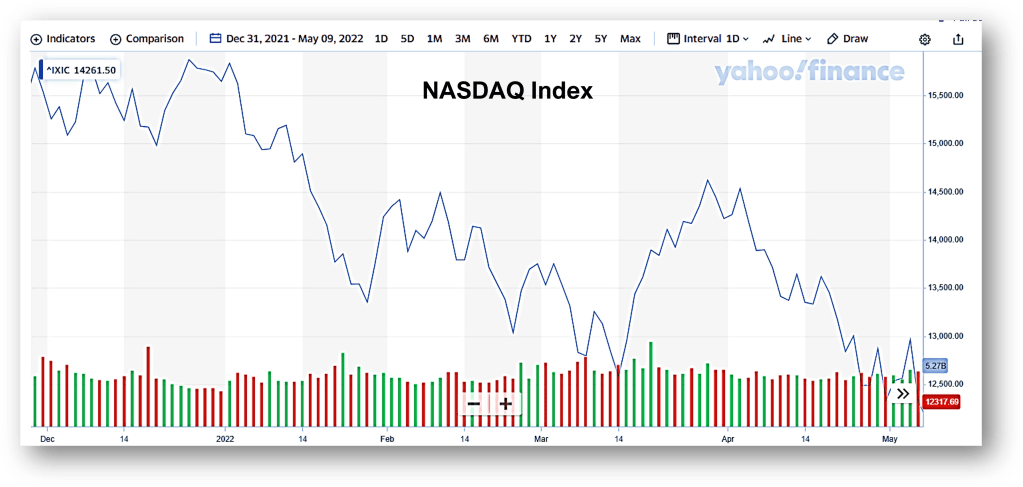
a 25% decline in the NASDAQ
None of these should come as a surprise to anyone. As Yogi Berra might say, “IT’s déjà vu all over again.”
In January 1966, the Dow Jones Industrial Average hovered around 8,891. But, by June 1982 – after years of decline, the DJIA had surrendered 72% of its value closing around 2,406. “The Nifty Fifty” – a group of cutting-edge, high-tech companies including Xerox, Polaroid, Kodak, etc. had vaulted the DJIA to lofty levels. It seems speculators were willing to pay 50-100 times earnings – not unlike some of the valuations we’ve seen in the recent market environment.
The late 1990’s also saw similar valuations placed upon countless dot.com/high tech companies as the world prepared for Y2K.
When speculation ramps up, it can drive equities to levels that simply aren’t sustainable or justifiable. Is it any wonder the NASDAQ has lost 25 percent so far this year?
Investors and speculators seeking refuge in fixed income won’t find much comfort either. If interest rates continue to rise – as they’re likely to do, bond valuations will also decline.
As a reminder of this, I keep a de-commissioned “50-year bond” certificate on my wall. The bond was issued in 1945 by the Reading Railroad Co. (yes, the same one from Monopoly). The bond was set to mature in 1995 and the attached coupons paid an annual rate of 3.25%.
In 1972, the bond was surrendered. The owner would have likely seen a 40% drop in the value of the bond as interest rates climbed from 5.45% in March 1972 to 6.66% in July.
It’s impossible to know what interest rates or markets will do over the short term. There are advantages to be had by studying market history and those of us over 55, have been to this rodeo before.
Last August, J.P. MorganAsset Management released “Retirement By the Numbers,” a report that examined how investors approaching retirement manage their portfolios, their income and their spending.
The report drew on a data base of 23 million 401(k) & IRA accounts. They reviewed the activities of some 31,000 people as they approached or began retirement between 2013-2018. (401(k) and IRA are retirement accounts similar to RRSP & RRIFs).
Findings
Research from the report suggested:
a) “De-risking” is common place. Three quarters of retirees reduced their equity exposure after “rolling over their assets from a 401(k) (RRSP) to an IRA (RRIF).
b) Retirees relied on the mandatory minimum withdrawal amounts when determining how much income to draw.
c) Income and spending are highly corelated. Where income amounts were increased (i.e. from social security, pension plans, etc.) spending followed.
Retiree Profiles
The retirees studied in the report shared the following characteristics:
a) Roughly 30% of the subjects received pension or annuity income.
b) The median value of retirement accounts was $110,000.00
c) The median investable assets were estimated to be between $300,000 and $350,000.00 (i.e. balance being held in non-registered accounts).
d) The most common retirement age was between 65-70.
e) Age 66 was the most common age to start receiving Social Security.
Other Observations
The study also recognized the following trends.
First, retirees who waited until the rollover date to “de-risk” (i.e. rebalance their portfolios) needlessly exposed themselves to market volatility and the potential for loss. For example, those re-balancing their portfolios in April 2020 after the COVID pandemic, were still down 5-6% after the markets had recovered a year later. Retirees ought to consider rebalancing portfolios prior their obligatory rollover (age 71).
Second, the majority of retirees were using the RMD-required minimum distribution as a guide for withdrawal amounts versus basing amounts on retirement income needs. Like U.S. IRAs, Canada’s RRIFs are also subject to a minimum withdrawal schedule that increases with age. Retirees relying on the schedule for guidance could limit or see future income amounts reduced.
Finally, 62 year-olds represent the peak year of 9.6 million baby boomers in Canada (and the greatest years of nest egg risk are between the ages of 58-66) Should they retire and de-risk en masse, Canadian equity markets will likely undergo increased downward pressure and volatility. Retirees should consider re-balancing or “annuitizing” while markets are fully valued and prior to an increase in capital gains or interest rates.
NOTE: This blog first appeared in the October 2021 edition of the Capital Partner
This past week, I viewed a webinar presentation by Tom Hegna . Mr Hegna is an economist, a “retirement expert” and author of Pay Cheques and Play Chequesand other retirement books.
During his presentation, Mr. Hegna highlighted 10 different risks unique to “retiremenThis past week, I viewed a webinar presentation by Tom Hegna . Mr Hegna is an economist, a “retirement expert” and author of Pay Cheques and Play Chequesand other retirement books.
During his presentation, Mr. Hegna highlighted 10 different risks unique to “retirement.” They included:
Deflation – the risk that goods and services might decline (like during the Depression)
Market Risk – the chance of a sustained bear market
Withdraw Rate Risk – the risk of drawing down too much from your nest egg
Sequence of Returns– risk of a permanent capital loss by drawing funds in a down market
Regulatory Risk – a change or failure in regulatory framework (governance, Madoff)
Taxation Risk – a hike in current rates or the imposition of new unforeseen taxes
Inflation – an across the board increase in the cost of needed goods and services
Long Term Care – the risk that a senior will require years of costly palliative care
Mortality – the risk of a premature death
Of all the risks he highlighted, “longevity risk” was the most critical. It’s what he called the “Retirement Risk Multiplier.” IF that risk was not addressed first, the other risks could easily become more acute.
Life expectancy is a bit of a moving target and a tough concept for most. Most people see that life expectancy is around 84 for males and around 87 for females. What people miss is that notion that these numbers represent “averages.” They shouldn’t necessarily be used for planning purposes.
There’s a 50/50 chance (i.e. 1 in 2) that one member of a 65 year old couple will live to age 92 and a 25% (i.e. 1 in 4) that one member will live to age 97.
Hegna also noted, of all the risks retirees are exposed to, longevity risk is the easiest to take “off the table.” He advises retirees to calculate their basic human needs (food, clothing, shelter, utilities, etc.), see how much is covered by CCP and OAS and to top up income with an annuity – which guarantees retirees will never run out of income nor ever take a cut in pay (recent rates can be viewed here: https://think-income.com/annuity-info/ ).
Finally, Hegna noted how most brokers and financial planners run “Monte Carlo” analysis as a means of measuring and managing “risk.” Yet, their proposals always have a disclaimer on the bottom of the page their retirement illustrations that reads, “63% of plans fail to provide income at or after age 90.”