Happy to present an updated due diligence video on Rio-Can Real Estate Investment Trust. Rio-Can is one of Canada’s largest commercial landlords. Units of the trust can currently be purchased at a discount to NAV (net asset value). Rio-Can REIT closed today at $22.83 /unit on the Toronto Exchange (REI.UN). That ‘s about a 12% discount to book value of $25.90 as reported at the end of Q3-22.
Their future looks bright and there best days are still yet to come. It’s a good deal.
Real estate investors can go at it alone developing projects – completing zoning applications, appeasing bankers, paying for legal work, etc. Or, they can purchase units, become unitholders of Rio-Can, own a pro-rata share in some of the best placed properties in the country and ride on the coat tails of some of the country’s top real estate minds.
2) Ralph L. Block – longtime proponent of REITs (real estate investment trusts) and author of Investing in REITs
Ben Graham revolutionized the investment industry by suggesting long-term investors take a business approach when assessing the value and potential growth of stock and bond securities. For him, that meant paying attention to fundamentals like earnings and earnings growth, purchase price and a number of profitability ratios.
Graham never addressed REITs in his classic investing book because they’re a more recent phenomena (i.e. modern REIT legislation was established in the 1990s).
Henry Block wrote his definitive book on REITS in 2002. In his book, “Investing in REITs,” Block introduced readers to REIT structures, types of REITs (residential, industrial, etc.) and how to decipher the balance sheet (why do we use FFO to gage REIT performance vs. Net Income?). That book was written two decades ago.
Thomas’ book does a wonderful job of combining the wisdom of both these authors and updating readers with more recent trends. Technology has radically changed the nature of home and office properties over the past twenty years and Thomas does a commendable job of leading the reader through the changes.
In this video published today on YouTube, I review the latest Q3-22 operating results from Allied Properties Real Estate Investment Trust. The Business is coping in a tough office environment and currently available at some compelling valuations.
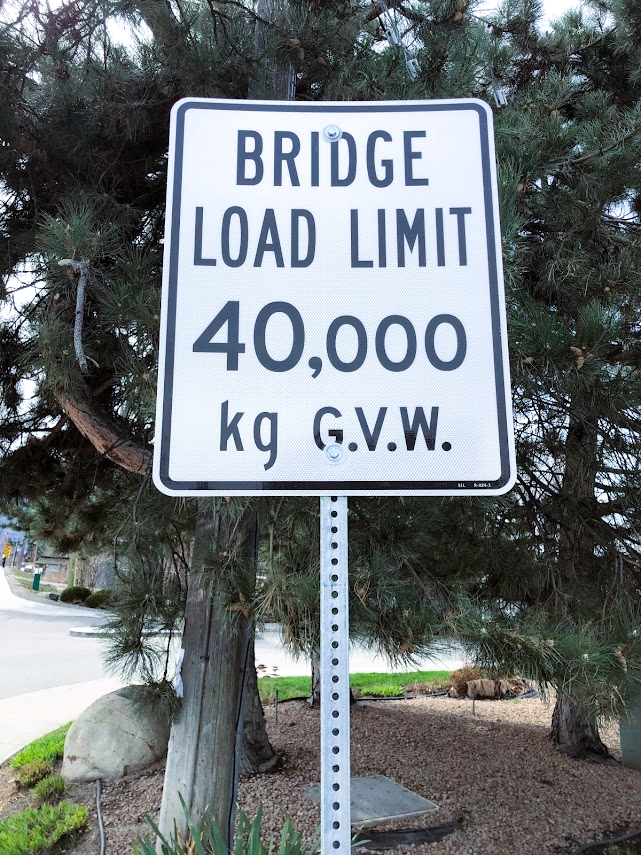
If you understood a business perfectly and the future of the business, you would need very little in the way of a margin of safety. SO, the more vulnerable the business is, assuming you still want to invest in it, the larger margin of safety you’d need. IF you’re driving a truck across a bridge that says it holds 10,000 pounds and you’ve got a 9,800 pound vehicle, if the bridge is 6 inches about the crevice it covers, you may feel okay, but if it’s over the Grand Canyon, you may feel you want a little larger margin of safety.”
Warren Buffett, 1997 Berkshire AGM
Over the past few days, I’ve been posting the first quarter operating results of top ten REITs from our property portfolio.
Most of the REITs have reported satisfactory results. They’ve all survived the pandemic and now they’re emerging as expected. Revenues, Net Income, FFO (Funds from Operations), SPNOI (Same Property Net Operating Income) and Occupancies were up for the most part. Outstanding rents have been recovered. Most are proceeding with further development of their pipelines.
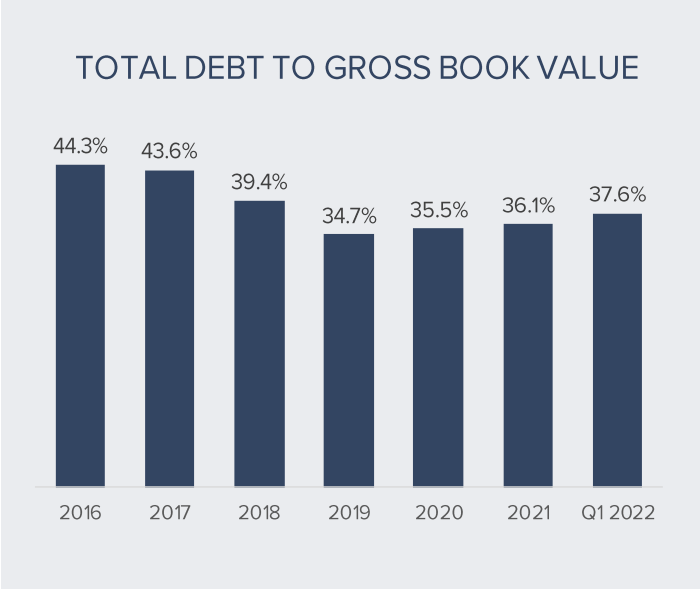
A couple of exceptions bear note. Figures at H&R REIT were a bit abnormal. Last Summer, H&R REIT sold the Bow to affiliates of Oak Street Real Estate Capital. “The Bow” is one of the tallest buildings in Western Canada and it was a crown jewel in H&R’s property portfolio. Then, they spun off a large division of their enclosed shopping centres (including Orchard Park Shopping Centre). Those properties now trade as Primaris REIT (listed on the TSE under PMZ.UN). As a result, H&R’s results weren’t “normalized.”
Also, Allied Properties REIT – which focuses on Office properties had occupancies dip below 90%. Not everyone is in a hurry to return to the office. But, Allied’s brick and beam properties appeal to younger professionals – especially in the digital, high tech and telecommunications sectors. They’re desirable locations to work and they should start to see occupancies return closer to capacity.
Hence, I was curious. Given that most operating results have been “normalized,” how was the marketplace valuing these REITs compared to their book value /unit – a figure that’s meant to represent current or fair market value (FMV).
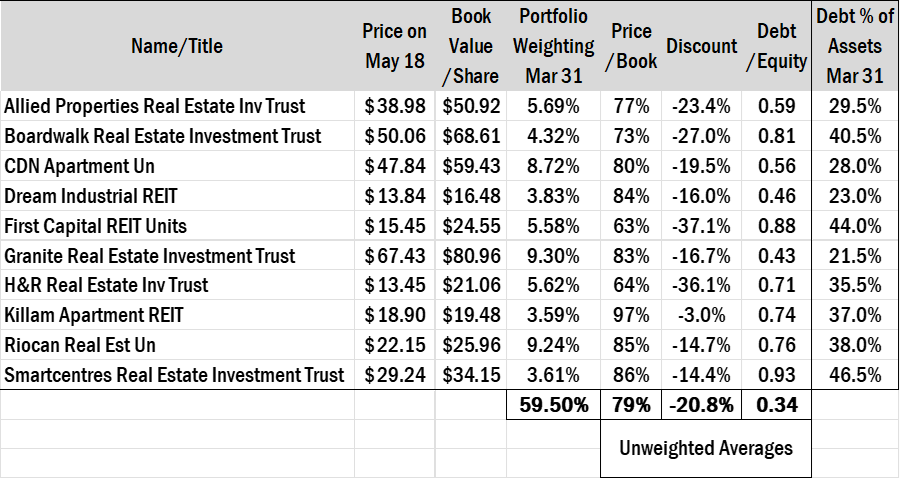
The table below lists the results of my inquiry. On Wednesday, May 18, all of our REITs were all selling below book value. Theoretically, the properties could be sold into the market place and unit holders would realize a gain on the difference between the REITs unit price and the underlying assets. In some instances, those discounts were 30% or more. An unweighted average suggests the top ten holdings are selling about 20% below their fair market price in aggregate.
I’ve also included their debt ratios as a means of gaging how leveraged they are (higher debt levels erode unitholders’ equity during downturns). Most are conservatively financed with debt ratios ranging between 21.5% of assets (Granite) and 46% of assets (Smartcentres).
In his book, The Intelligent Investor, Ben Graham talks about 2 concepts central to his approach to investing. The first is the idea of “intrinsic value.” He suggests investing (not speculating or trading) should involve independently reviewing the business attributes of a securities issue (i.e. future cash flows, etc.) and assigning a value to that enterprise. That value might ultimately represent what a prudent or reasonable person would pay for the property or business in a private business transaction.
Then, recognizing that errors could be made with assumptions, calculations, etc., one should leave a “margin of safety” prior to committing capital. By buying at a discount to intrinsic value (i.e. a margin of safety) an investor helps to protect against downside and a permanent capital loss. It’s how one preserves capital.
It’s impossible to predict what the capital and real estate markets will do over the short term, but for patient, long term investors, a portfolio of REITs might represent a solid opportunity to enhance your and your family’s wealth.
On May 17-2022, Canadian Apartment REITs published their first quarter business results. They are the last of our property portfolio “partners” to report.
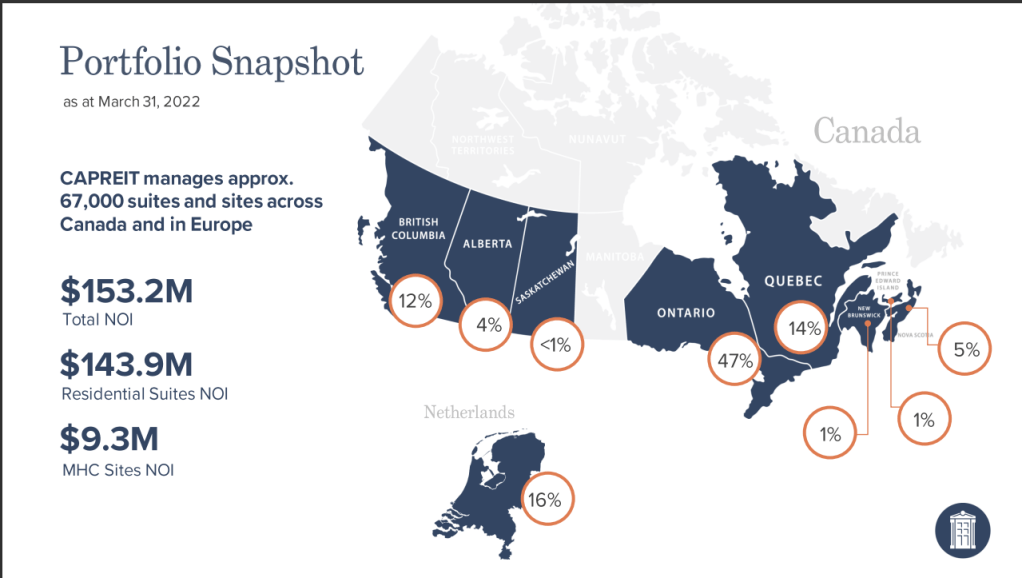
In addition to being the largest residential REIT and one of the largest holdings in our real estate portfolio, CAP REIT is also the largest landlord in Canada. Their operations are a fairly telling bell weather of the residential real estate business in Canada.
As of March 31, 2022, they reported the following results:
“Following another strong and accretive year in 2021, we continued to generate solid growth and strong operating performance in the first quarter of 2022. Occupancies rose to 98.0% at March 31, 2022, up from 97.3% at the same time last year while average monthly rents increased 3.9%. Importantly, our balance sheet and financial position remained strong and resilient with a significant liquidity position.”
“Total operating revenues increased 8.4%, driven by the contribution from acquisitions completed over the last twelve months, increased stable occupancies and higher average monthly rents. Total property Net Operating Income (“NOI”) rose 4.4% compared to the same period last year. Stabilized property NOI decreased slightly in the quarter due increased weather-related maintenance costs, higher utilities costs resulting from the colder winter this year and a significant increase in the cost of natural gas, and higher property taxes. Importantly, to date we have collected over 99% of our rents, a testament to our successful initiatives to work with our residents and understand their issues through the pandemic.
During 2021, we acquired 3,744 apartment suites, townhomes and manufactured housing community sites in Canada and the Netherlands for total costs of approximately $1.05 billion. In the first three months of 2022, we further expanded our property portfolio with the purchase of 1,015 suites and sites for total costs of $439million[1]. These new properties will make a strong, accretive and growing contribution in the months and years ahead. Looking ahead, while our acquisition pipeline remains strong and robust, we will also be examining our total portfolio to determine opportunities to generate value for our Unitholders and additional capital to fund more accretive growth opportunities.”
[1] Average cost per (apartment) units purchased in Q1-2022 was approx. $432,512.31. Average cost per units purchased in 2021 was $280,448.71. That amount includes the purchase of “townhomes and MHCs,” which would explain the lower average suite cost.
This Post is published on or around May 17th, 2022, and it includes timely information that can be quickly rendered obsolete. It is FOR INFORMATION PURPOSES and simply meant to keep partners informed about some of the holdings in our portfolios. This is NOT an OFFER to purchase securities or products & NO representation is being made. Items presented may NOT be suitable for everyone. Rates change. Values will fluctuate. Please consult an experienced, qualified, licensed professional prior to investing and ensure that your investments are a part of a comprehensive plan designed to help you & your family meet your long-term financial goals & objectives.
Gordon Wiebe is registered as a “Life, Accident & Sickness” insurance underwriter with the Insurance Council of B.C, the Alberta Insurance Council & the Saskatchewan.
Nearly all the REITs held in our Real Estate investment contracts have reported their first quarter earnings. Canadian Apartment REIT reports tomorrow.
Normally, one shouldn’t attach too much significance to quarterly earnings as it can take years for the value of great properties and enterprises to be realized. Nevertheless, operating results for the first quarter are presented here as an indicator of how business operations are unfolding as the REITs and economy emerge from pandemic restrictions.
Overall, revenues, income, funds from operations (FFO), occupancies have improved significantly. CAP REIT reports tomorrow. Rio-Can figures reported in an earlier blog and can be viewed here: https://think-income.com/2022/05/11/getting-it-reit/
On April 27, Allied Properties REIT reported the following:
“Allied’s first-quarter results for 2022 met or exceeded expectations, with AFFO per unit and average in-place net rent per occupied square foot rising to record levels,” said Michael Emory, President & CEO. “FFO per unit was 61 cents and AFFO per unit 56 cents, up from the comparable quarter last year by 4% and 7%, respectively. NAV per unit at quarter-end was $50.92, up from the end of the first quarter last year by 5% and up from the end of 2021 by 1%. Leasing activity continued to accelerate through the quarter, with average in-place net rent per occupied square foot rising to $25.13, up from the comparable quarter last year by 4% and up from the end of 2021 by 2%.”
On May 9th, Boardwalk posted their quarterly results. Chairman & CEO Sam Kolias reported:
“We are pleased to report on another solid quarter to begin 2022, with growth in NOI, FFO, and Profit through the Omicron wave of the pandemic and non-controllable cost inflation primarily in our utilities expense through the winter months. As we look forward to our busy spring and summer leasing season, we have seen significant leasing gains with our May occupancy increasing to 96.6%. Leasing spreads on both renewals and new leases have seen strong improvement, and in our largest market of Alberta, have seen renewal spreads increase to 4.7% in the month of April. New lease spreads have also turned positive with housing fundamentals improving in each of our markets allowing for incentive reductions and positive rental rate growth.”
On May 3rd, Dream Industrial reported net income of $442.9 million in Q1 2022, a 364.9% increase when compared to $95.3 million in Q1 2021. The increase was primarily due to increases in fair value adjustments to investment properties (NOTE: companies are required to include unrealized gains in the value of assets as a part of earnings).
Net rental income was $65.3 million in Q1 2022, a 40.0% increase when compared to $46.7 million in Q1 2021. Year-over-year net rental income growth was primarily driven by 38.8%, 46.5% and 264.9% increases in Ontario, Québec and Europe, respectively.
Diluted funds from operations (“FFO”) per Unit were $0.22 in Q1 2022, a 16.0% increase when compared to Q1 2021, where the diluted FFO per Unit were $0.19.
• Total assets were $6.7 billion in Q1 2022, a 10.8% increase when compared to $6.1 billion in Q4 2021;
• Net asset value (“NAV”) per Unit was $16.48 in Q1 2022.
For the three months ended March 31, 2022, First Capital recognized net income attributable to Unitholders of $44.5 million or $0.20 per diluted unit compared to $38.0 million or $0.17 per unit for the same prior year period. The increase was primarily due to an increase in the fair value of investment property of $8.8 million.
FFO per unit remained unchanged primarily due to a $3.1 million increase in interest and other income, and interest expense savings of $2.8 million, which were offset by other losses primarily related to unrealized losses on marketable securities, totaling $6.8 million, or $0.03 per unit.
SPNOI – Same Property NOI Growth increased 1.9%, despite a 20 basis point decline in occupancy. The growth was primarily due to a $2.2 million decrease in bad debt expense as well as rent escalations, partially offset by lower occupancy and a $0.6 million decrease in lease termination fees over the prior year period.
Portfolio Occupancy: March 31, 2022 portfolio occupancy of 95.5% decreased 0.6% on a quarter-over-quarter basis from 96.1% at December 31, 2021 primarily due to net closures (which primarily related to closures for redevelopment). On a year-over-year basis, total portfolio occupancy declined 0.3% from 95.8% at March 31, 2021 to 95.5% at March 31, 2022.
Granite’s net operating income (“NOI”) was $91.2 million in the first quarter of 2022 compared to $81.5 million in the prior year period, an increase of $9.7 million primarily as a result of net acquisition activity beginning in the first quarter of 2021;
• Same property NOI (Net Operating Income) or SPNOI – cash basis increased by 4.6% for the three-month period ended March 31, 2022.
• Funds from operations (“FFO”)(1) were $69.4 million ($1.05 per unit) in the first quarter of 2022 compared to $57.1 million ($0.93 per unit) in the first quarter of 2021.
• Granite recognized $490.6 million in net fair value gains on investment properties in the first quarter of 2022 which were attributable to various factors including fair market rent 1 increases as well as compression in discount and terminal capitalization rates for properties located in the GTA, the United States and Europe. The value of investment properties was partially offset by unrealized foreign exchange losses of $146.1 million resulting from the relative strengthening of the Canadian dollar against the US dollar and
• Granite’s net income attributable to stapled unitholders increased to $497.7 million in the first quarter of 2022 from $230.1 million in the prior year period primarily due to a $281.1 million increase in net fair value gains on investment properties and a $9.7 million increase in net operating income as noted above, partially offset by a $30.6 million increase in deferred tax expense
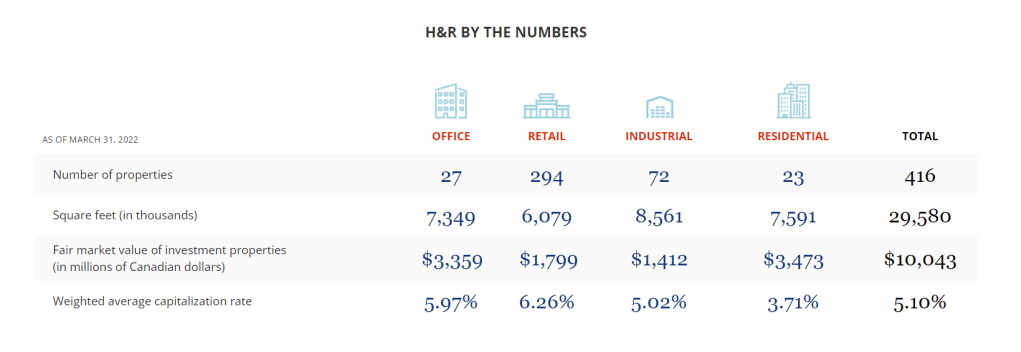
On May 12, 2022, H&R Real Estate Investment Trust (“H&R” or “the REIT”) (TSX: HR.UN) reported the following operating results:
“Our strong first quarter financial results mark a pivotal moment in the continuation of our transformation and the surfacing of the embedded value within our portfolio,” said Tom Hofstedter, CEO. “Following the successful spin out of our enclosed shopping centre division (i.e. Primaris) and the sale of the Bow and Bell office campus, our portfolio today is significantly more concentrated on higher growth asset classes within strong urban markets. Today’s results are a testament to the quality of our properties, platform and strategic plan.”
Highlights
30.9% decrease in net operating income as compared to Q1-2021 primarily due to the spin‐off of Primaris REIT and property dispositions throughout 2021;
$19.88 unitholders’ equity per Unit, an increase of $3.33 from December 31, 2021;
$21.06 Net Asset Value (“NAV”) per Unit(2), an increase of $3.36 from December 31, 2021;
Sold 33.3% non‐managing interest in The Pearl, in Austin, Texas for approximately U.S. $45.8 million, generating a gain of $20.7 million over construction cost, and a return on equity invested of approximately 221.5%;
13,715,500 Units repurchased year to date, at a weighted average price of $12.97 per Unit, for a total cost of $177.8 million as at May 10, 2022;
19.1% Same‐Property net operating income (SPNOI) (cash basis)(1) growth driven by strong residential and office rental growth together with industrial and retail property lease‐ups
“Killam’s first quarter earnings growth and operating performance were strong,” noted Philip Fraser, President and CEO. “The same property revenue growth of 5.1% in Q1-2022 reflects the strong demand for housing across all our markets. Despite a colder winter season and higher heating costs this quarter, Killam achieved 3.1% same property net operating income growth to start the year.”
Killam earned net income of $60.0 million in Q1-2022, compared to $27.4 million in Q1-2021. The increase in net income is primarily attributable to fair value gains on investment properties, growth through acquisitions, completed developments, and increased earnings from the existing portfolio.
Killam generated FFO per unit of $0.24 in Q1-2022, a 4.3% increase from $0.23 per unit in Q1-2021. AFFO per unit increased 5.3% to $0.20, compared to $0.19 in Q1-2021. The growth in FFO and AFFO was primarily attributable to increased NOI from Killam’s same property portfolio and incremental contributions from over $400 million in recent acquisitions. This growth was partially offset by a 9.4% increase in the weighted average number of units outstanding.
Despite inflationary pressures, Killam achieved 3.1% growth in same property consolidated NOI during the quarter. This improvement was driven by 5.1% growth in revenue, partially offset by an 8.2% increase in operating expenses.
On May 11, SmartCentres REIT reported, “substantive improvement in retail leasing momentum across the portfolio with growth from both existing and new tenants;”
Highlights:
Progress in zoning approvals on strategic projects, together with improved market conditions, contributed to $237.7 million in incremental property values, leading to net income and comprehensive income for Q1 2022 increasing to $370.1 million compared to $60.6 million for the same period in 2021; from an increase of $1.71 per Unit;
FFO per Unit(1) for Q1 2022 increased by $0.02 or 4.1% as compared to the same period in 2021;
Total unencumbered assets(1) increased from $5.9 billion at March 31, 2021 to $8.4 billion at quarter end; and
Continued advancement of non-retail pipeline of 283 projects representing approximately 59 million square feet across the network (41 million square feet at the Trust’s share)
The Well in Toronto is Canada’s Largest Development ever. It’s Being Managed by RioCan & Allied REITs.
If anyone needed further evidence showing how uncorrelated a company’s share price (or a REIT’s unit price) can be from its underlying value, RioCan (REI.UN) provided a good example yesterday.
Net income of $160.1 million, exceeding the comparable period last year by $53.3 million
FFO (Funds from Operations) of $0.42 /unit, up 27% year of year (YoY)
A 4.1% increase in SPNOI – Same Property Net Operating Income
1.1 million sq. ft. of new and renewed leases
Occupancy was 97% – up to pre-pandemic levels
42.6 million ft2 in the “development pipeline”
16.8 million ft2 of zoning approved
2.2 million ft2 under construction
2.5 million ft2 “shovel ready”
3.2 million ft2 actively being “redeveloped”
1.7 million ft2 expected to be delivered in the next 24 months
27.4 million of new funds expected in 2022
Weighted interest costs are at 2.98%
Book Value /unit $25.96 as of March 31, 2022.
Most landlords would be satisfied with those quarterly results. So, how did the market respond to their business operations? The unit price dropped $1.15 or 5% to $20.65 from $21.80 and then closed at $20.99. It was one of the most traded issues on the Toronto Stock Exchange.
RioCanowns and operates 204 premier retail properties in Canada. They lease over 36 million square feet of space and their enterprise value is roughly $15 billion.
At $21 /unit, an investor can purchase a pro-rata interest at a discount of 19%.
Research suggests many of them used their home equity to acquire HELOCs (Home Equity Lines of Credit). Then, they leveraged the HELOCs to secure a down payment while financing the rest of the real estate purchase with a traditional mortgage (NOTE: in Canada, real estate investors must commit 20% of the property value but can finance the rest with a traditional mortgage).
Interest rates on HELOCs float with the prime rate. Borrowers are obligated to pay interest, but not principal. So, many of the investment properties would really have been financed 100% – a problem the author is wise to report on.
Studies indicate 37% of Toronto landlords are already cash flow negative
Benjamin Tal & Shaun Hildebrand – Urbanation
As interest rates rise, landlord’s carrying costs increase. Studies indicate 37% of them are already cash flow negative. Many of them will likely be inclined to raise rents in an inflationary environment. Expect some tension on that front. For the record, I’ll be siding with the tenants on this one – many of whom should have been “first time home buyers” but were sidelined as secondary parties drove up values.
Real estate investors will have bid up the price on properties betting the increase in real estate values will make up for period of negative cash flow (much like owners of NHL franchises who frequently operate at a loss, but are rewarded when they sell the franchise for a premium).
Figures from article.
But, what if values don’t continue to rise – at least over the short – medium term? How much pain can those new landlords endure? What happens if property values decline? Will they stay the course or will they dump their investments and realize losses?
There are some very real risks involved in this scenario. The outcome could be worse than anyone imagined.